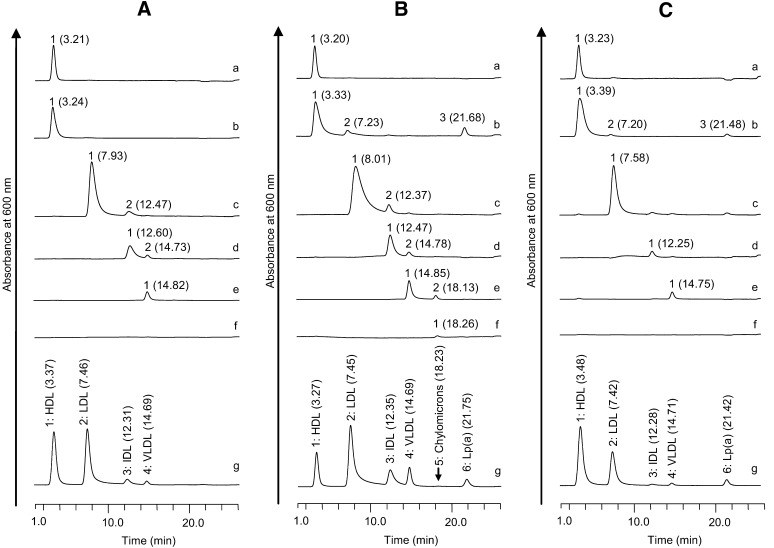
Fig. 1.
Chromatograms of lipoproteins separated from three sera by ultracentrifugation. The chromatograms a, b, c, d, e, f, and g are the fractions of HDL3 (1.125 g/ml < d), HDL2 + dense LDL + Lp(a) (1.060 < d < 1.125g/ml), LDL (1.019 < d < 1.060g/ml), IDL (1.006 < d < 1.019g/ml), VLDL (d < 1.019 g/ml, and flotation rate 20–400), and chylomicrons (d < 1.019g/ml and flotation rate >400) separated from the sera by the ultracentrifugation method and the serum, respectively. A–C show the chromatograms of Subjects 1–3, respectively. The numbers in the parentheses are the retention time of each peak.

