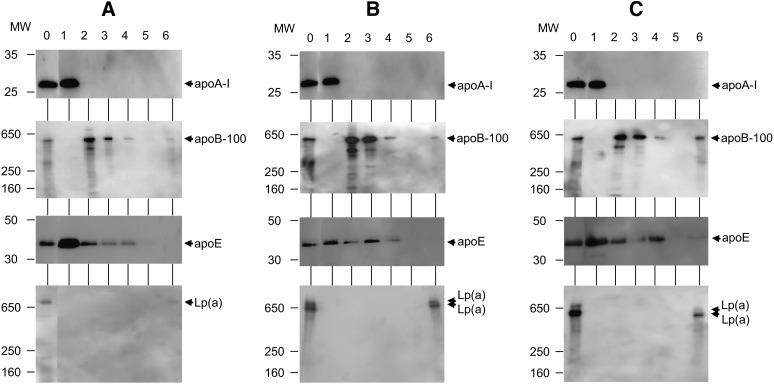
Fig. 2.
Western blot analysis for Peaks 1–6 fractionated by the HPLC method. Samples of the fractionated Peaks 1–6 were analyzed using Western blot analysis with SDS-PAGE. Lanes 0–6 are the serum sample and Peaks 1–6, respectively. Four gels and goat polyclonal antibodies were used against apoA-1, apoB, apoE, and apo(a) to detect the apolipoproteins in the serum and six fractionated samples. For analysis of the apoA-1 and apoE, and apoB-100 and apo(a), 5–20% gradient gel and 5% gel were used, respectively. A: The serum of Subject 1 and the fractionated samples were used. The 27 kDa bands (apoA-1) were detected in lanes 0 and 1 of the first gel. The 500 kDa bands (apoB-100) were detected in lanes 0, 2, 3, 4, and 6 of the second gel. The 35 kDa bands (apoE) were detected in lanes 0–4 of the third gel. A 730 kDa band [apo(a)] was detected in lanes 0 and 6 of the fourth gel. B: The serum of Subject 2 and the fractionated samples were used. The 27 kDa bands (apoA-1) were detected in lanes 0 and 1 of the first gel. The 500 kDa bands (apoB-100) were detected in lanes 0, 2, 3, 4, and 6 of the second gel. The 35 kDa bands (apoE) were detected in lanes 0–4 of the third gel. The 710 and 640 kDa bands [apo(a)] were detected in lanes 0 and 6 of the fourth gel. C: The serum of Subject 3 and the fractionated samples were used. The 27 kDa bands (apoA-1) were detected in lanes 0 and 1 of the first gel. The 500 kDa bands (apoB-100) were detected in lanes 0, 2, 3, 4, and 6 of the second gel. The 35 kDa bands (apoE) were detected in lanes 0–4 of the third gel. The 660 and 540 kDa bands [apo(a)] were detected in lanes 0 and 6 of the fourth gel.

