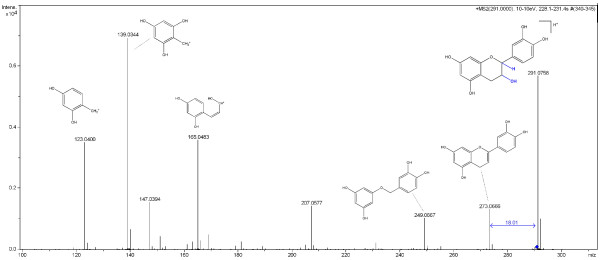
Figure 3.
Annotated tandem MS spectrum of Epicatechin. This spectrum for Epicatechin was measured on a Bruker-micrOTOFQ mass spectrometer and manually annotated by an expert. The measured peaks and corresponding fragments for the major signals are depicted. In addition, the non-topological water loss is highlighted in blue.

