
Figure 2.
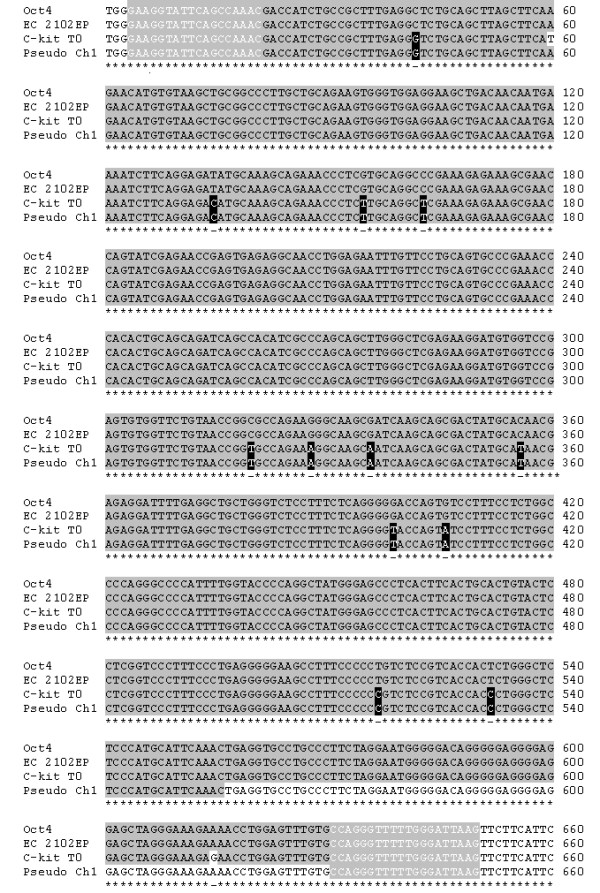
Oct4 sequence alignments. Alignment of Oct4 mRNA and pseudogene sequence from chromosome 1, with putative Oct4 RT-PCR sequenced products from freshly isolated c-kit+ cells (T0) and EC 2102Ep cells (+ control). The solid grey background indicates sequence homology, with base pair mismatches highlighted by white background. Black boxes indicate homology between c-kit+ and pseudogene sequences and disparity with Oct4. White letters on grey background denote primer positions.