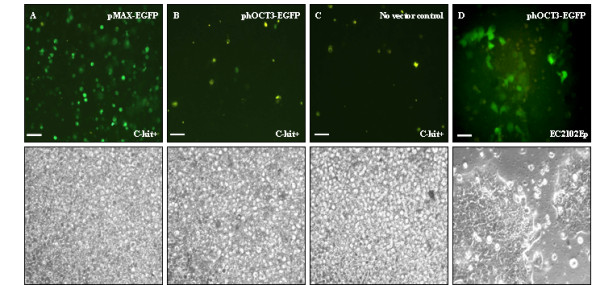
Figure 3.

Transfection studies on freshly isolated c-kit+ cells. Freshly isolated c-kit+ cells transfected with: A) positive control vector pMAX-EGFP; B) phOCT3-EGFP; C) No vector negative control; D) EC 2102Ep cells transfected with phOCT3-EGFP. Lower panel represents phase contrast images of the above GFP images. Original magnification 100× (A, B, C) and 200× (D). Scale bar 50 μM.
