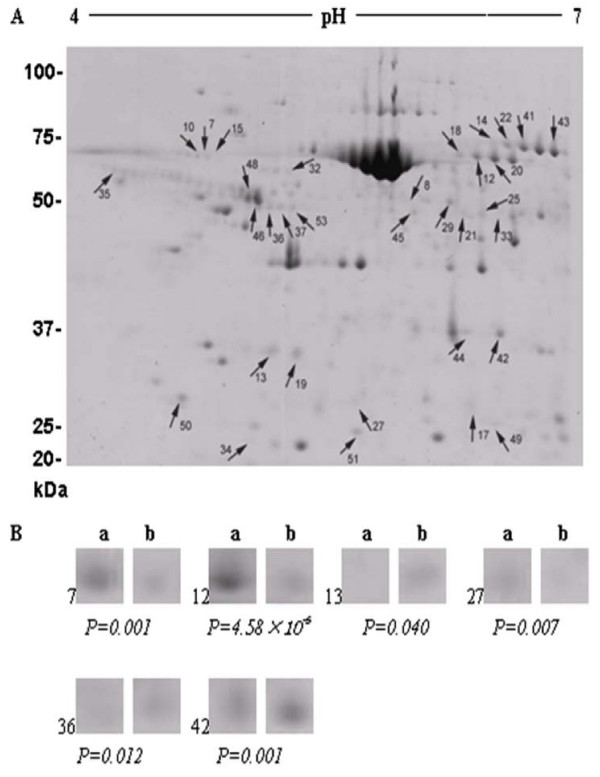
Figure 1.
Two-dimensional gel images of differentially expressed proteins with a high or low BF thickness in CHAR steers (A). The arrows indicate significantly differentially expressed proteins (spots) (P < 0.05) after identification by matching, background subtraction and spot volume normalization using the Progenesis software. The selected protein spots for MS analysis are also shown (B), demonstrating changes in intensity and significant difference.

