. 2010 Mar 31;8:32. doi: 10.1186/1479-5876-8-32

Figure 3.

Figure 3

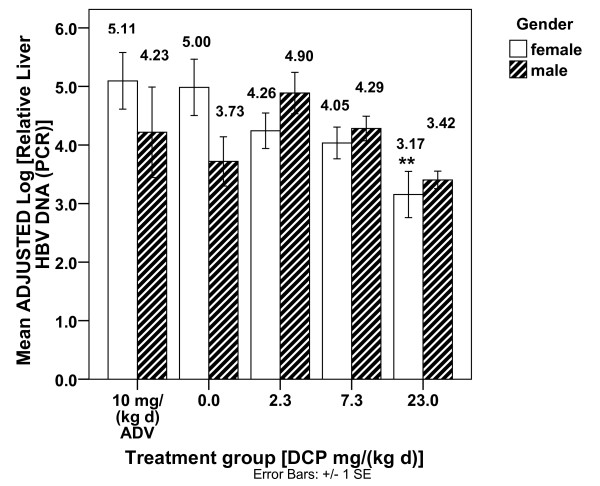
The ADJUSTED Log [rel. Liver HBV DNA (PCR)] by treatment group and gender calculated for each HBV mouse. In order to isolate the effects of DCP treatment away from the effects of the other DCP-EM variables, ADJUSTED Log [rel. Liver HBV DNA (PCR)] values were calculated for each mouse, based upon the Table 1, Table 2 regression model algebraically rearranged as follows:
graphic file with name 1479-5876-8-32-i1.gif

The ADJUSTED scores are graphed by treatment group and gender for the HBV mice (ADV = Adefovir dipivoxil). ** (p < .01) - Mean ADJUSTED Log [rel. Liver HBV DNA (PCR)] is significantly different than controls [DCP = 0.0 mg/(kg d) of the same gender] only for females at 23.0 mg/(kg d) DCP. No significant gender differences were found for any of the treatment groups (p ≥ .095).