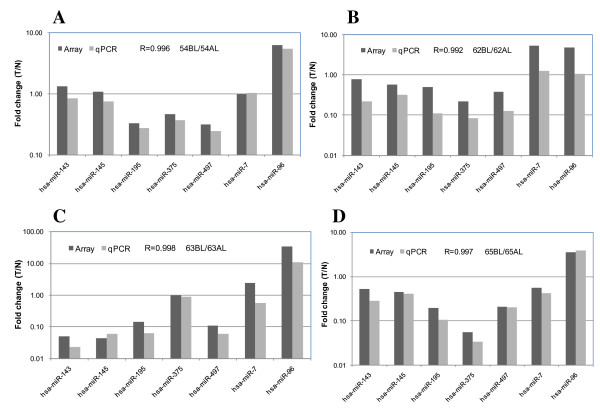
Figure 5.
Across-platform comparison. A) comparison of the fold changes in sample pair 54 determined by Agilent miRNA microarrays and by quantitative RT-PCR (54AL: LCM-selected epithelial cells of normal colorectal tissue; 54BL: LCM-selected epithelial cells of Dukes' B carcinomas); B) comparison of the fold changes in sample pair 62 determined by Agilent miRNA microarrays and by quantitative RT-PCR (62AL: LCM-selected epithelial cells of normal colorectal tissue; 62BL: LCM-selected epithelial cells of Dukes' B carcinoma); C) comparison of the fold changes in sample pair 63 determined by Agilent miRNA microarrays and by quantitative RT-PCR (63AL: LCM-selected epithelial cells of normal colorectal tissue; 63BL: LCM-selected epithelial cells of Dukes' C carcinoma) and D) comparison of the fold changes in the sample pair 65 determined by Agilent miRNA microarrays and by quantitative RT-PCR (65AL: LCM-selected epithelial cells of normal colorectal tissue; 65BL: LCM-selected epithelial cells of Dukes' D carcinoma). R indicates the average correlation of 7 individual miRNAs.

