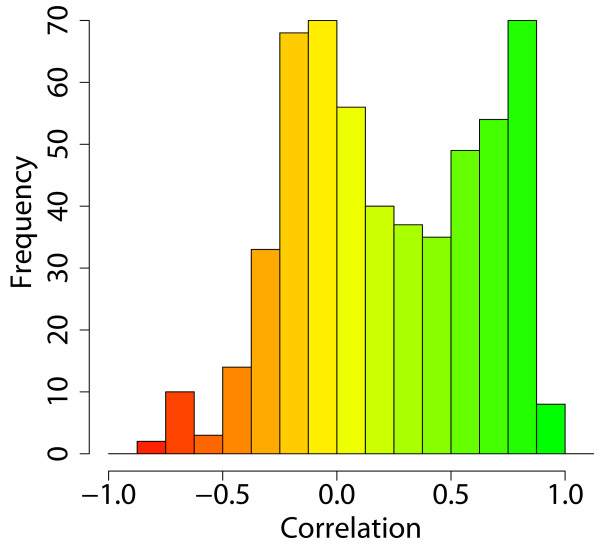
Figure 3.
Correlation between predicted flux and observed gene expression. The histogram shows the correlation between gene expression and predicted flux for 549 enzyme-coding genes. A large number of enzyme-coding genes show high correlation. They include many primary metabolism genes and antibiotic biosynthesis genes. About half of the genes show poor correlation; these are mostly genes that show constant gene expression and/or predicted flux across the entire time course, leading to a correlation coefficient close to zero. A small but noteworthy number of genes show statistically significant negative correlation between gene expression levels and predicted flux. These cases are discussed in more detail in the main text.

