
Figure 4.
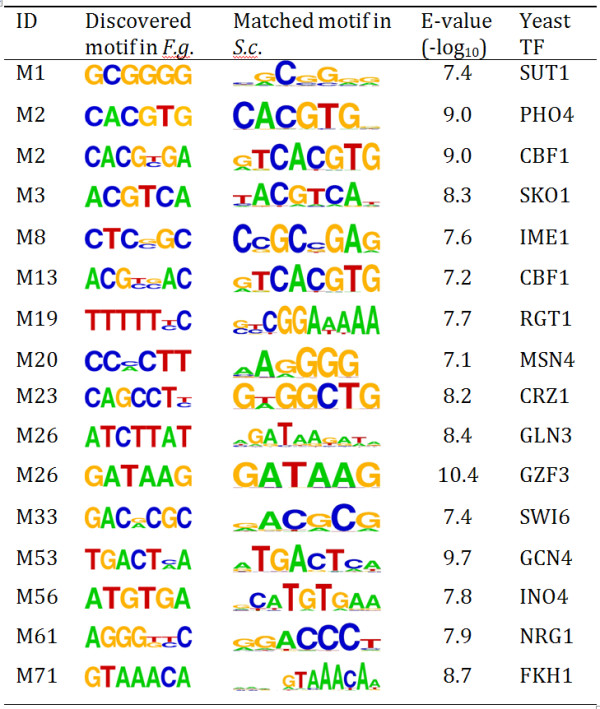
List of discovered F.g. motifs that match known motifs in S. cerevisae. Motif sequence similarity was measured by Pearson correlation coefficient. E-value represents the number of hits expected to occur by chance when comparing the F.g. motif to all known S.c. motifs.