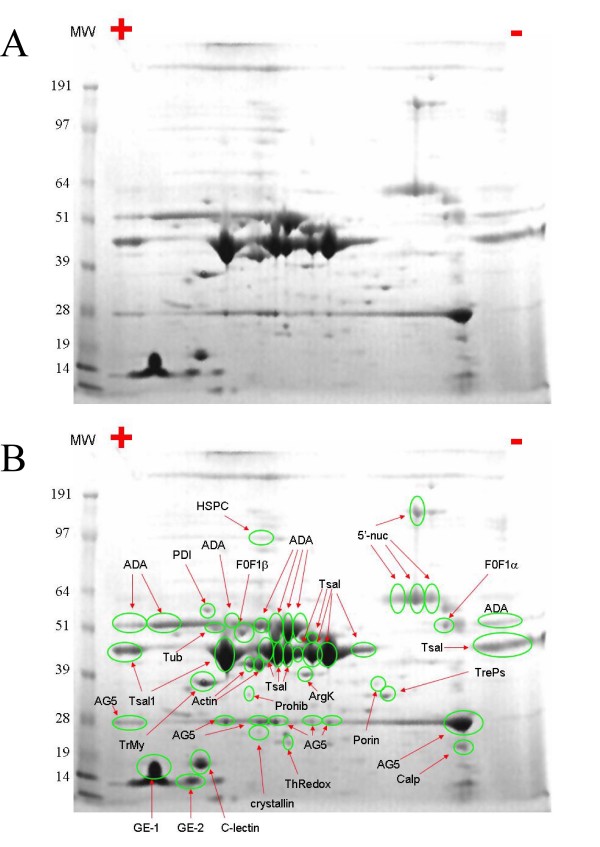
Figure 7.
2D gel electrophoresis of Glossina morsitans morsitans salivary gland homogenates. Numbers on the left indicate the molecular mass marker positions in the gel. The + and - symbols indicate the anode or cathode side of the isoelectrophocusing first dimension, which incorporates a pI range of 3.0 - 10.0. (A) Unmarked gel. (B) Protein spots identified (following tryptic digestion and mass spectrometry) are labeled on the gel. In some cases, several spots were identified as the same protein. For experimental details, see Materials and Methods.

