Figure 4.
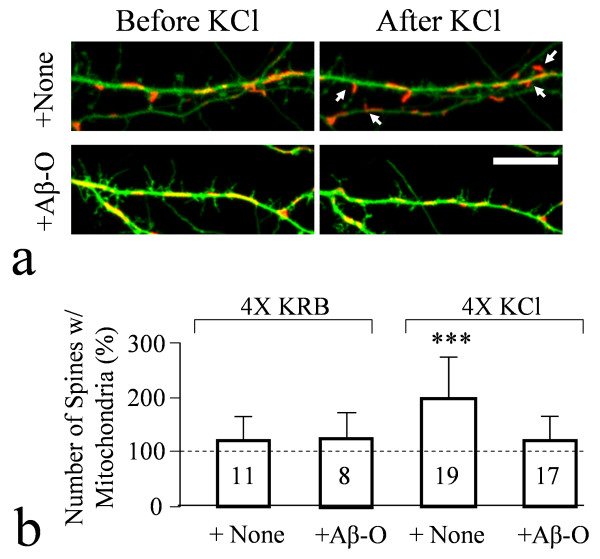
Aβ impairment of mitochondrial trafficking into spines in response to repetitive KCl depolarization. (a) Representative images of dendritic segments of hippocampal neurons expressing GFP and Mito-DsRed before and after repetitive KCl depolarization (4X), with (lower pair) and without (upper pair) 30 min exposure to Aβ oligomers. Arrows indicate spines containing mitochondria after the repetitive KCl depolarization. Scale bar: 10 μm. (b) Quantification of the number of spines containing mitochondria after repetitive exposure (4 times) to either KRB (control) or KCl, with and without Aβ treatment. The data are normalized against the number of spines before the repetitive exposure with 100% indicating no change. Triple asterisks: p < 0.0005 compared to the control (Student's t-test).

