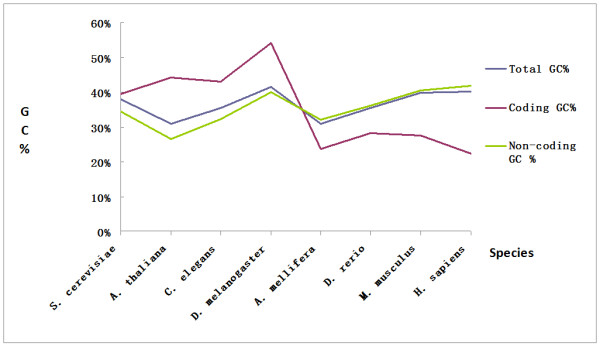
Figure 3.

Comparison of GC% in coding regions and non-coding regions. The GC% of both coding regions and non-coding regions in the whole genomes of eight organisms (S. cerevisiae, A. thaliana, C. elegans, D. melanogaster, A. mellifera, D. rerio, M. musculus, and H. sapiens) were compared. The GC% in the coding regions is higher than that of the non-coding regions in lower organisms, while reversed in higher organisms.
