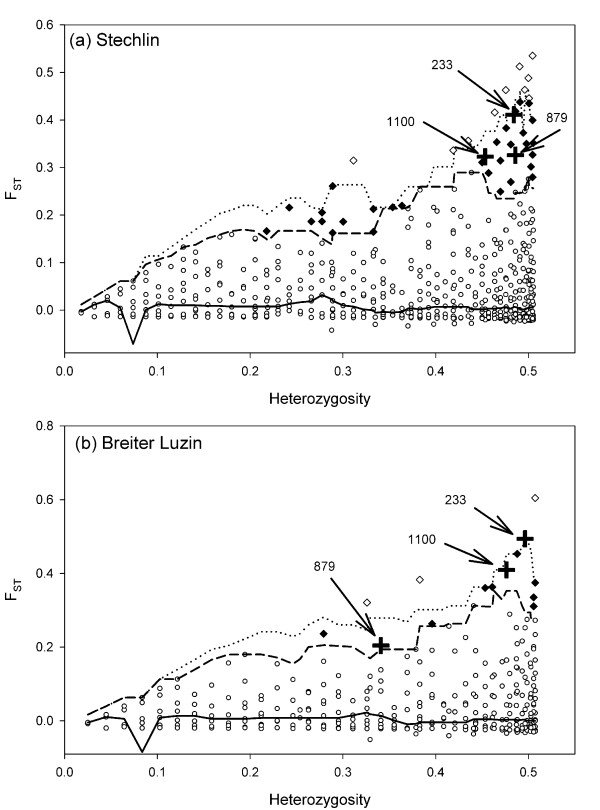
Figure 4.
Scatter plots of AFLP loci putatively under selection. Explorative genome scans comparing differentiation of AFLP loci to the expected neutral distribution under p > 0.99 and p > 0.95 for Lake Stechlin (a) and Lake Breiter Luzin (b). Loci positively exceeding expected neutral FSTs are indicated by white diamonds (p > 0.995) or black diamonds (p > 0.975). Loci shared from both lakes are numbered and indicated by black crosses. Lines indicate the median (solid), the 97.5% quantile (dashed) and the 99.5% quantile (dotted). Some symbols represent multiple loci with almost identical coordinates.

