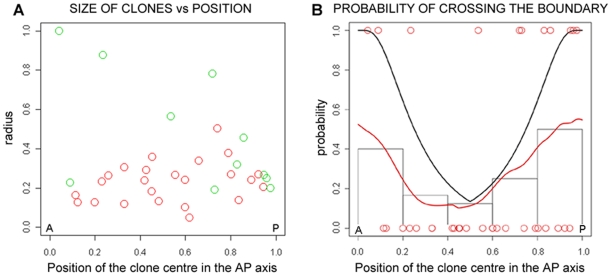
Figure 2. Estimated and theoretical probabilities for a clone to cross the boundary as a function of its position along the AP axis.
(A) The scatter plot shows the size of the observed clones versus its centre position along the AP axis of the rhombomere. Radii have been measured as relative to the AP length of the rhombomere (see Materials and Methods). Colour of each clone has been chosen to reflect if it respects the boundary (red circles) or it crosses the boundary (green circles). (B) Estimated and theoretical probabilities for a clone to cross the boundary as a function of its position along the AP axis. Red circles show the horizontal position of the centre of observed clones along the AP axis of the rhombomere (it has been rescaled to [0,1]). Clones crossing the boundary have been placed in vertical position 1, clones respecting the boundary in vertical position 0. The red line is the probability of crossing the boundary as given by a generalized additive model fitted to data. Grey step lines show a discrete version of the estimated probability as given by the fraction of clones contained in each interval that cross the boundary. The black line is the probability of crossing the boundary as given by the theoretical model that assumes no boundary effect on the behaviour of clones.

