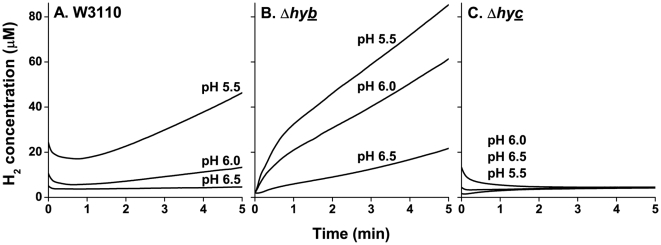
Figure 1. Effect of pH on the H2 production by W3110, ΔhybC, and ΔhycE.
The lines represent traces of H2 concentration as a function of time. Before time 0, the cultures were sparged with 100% N2 in order to eliminate any residual H2 in the culture. Anaerobic cultures of W3110 (A), ΔhybC (B), and ΔhycE (C) were grown to log phase at pH 5.5, pH 6, and pH 6.5 and assayed for H2 production as stated in the Materials and Methods. Lines are representative samples of n = 3.

