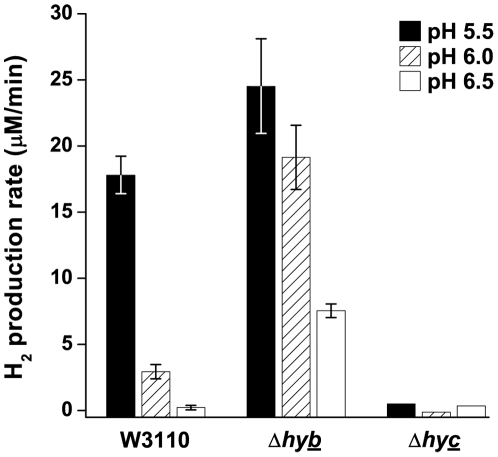
Figure 2. Effect of pH on the H2 production rate of W3110, ΔhybC, and ΔhycE.
Anaerobic cultures were grown to log phase at pH 5.5 (black bars), 6 (hatched bars), and 6.5 (white bars) and assayed for H2 production as described in the Materials and Methods. H2 production rate was calculated as stated in the Materials and Methods. Error bars represent SEM, n = 3; those that were too small to see clearly were omitted. The experiment was conducted twice.

