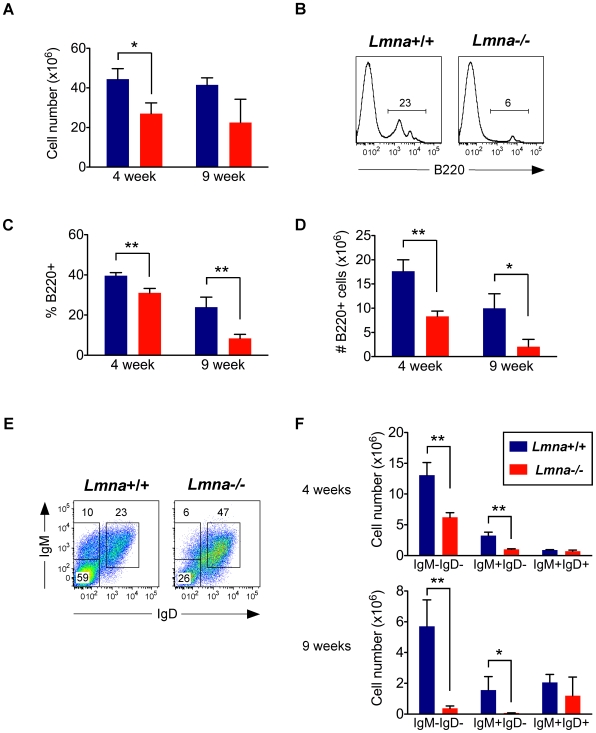
Figure 4. B cell development is impaired in Lmna -/- mice.
Bone marrow single-cell suspensions were stained for surface B220, IgM, and IgD expression. A. Absolute number of bone marrow cells. B. Representative histograms from 9-week-old mice showing the percent of bone marrow cells that are developing B220+ cells. C. The percent of bone marrow cells that are B220+ for each indicated age group. D. Absolute number of B220+ bone marrow cells for each indicated age group. E. Representative IgM/IgD plots of gated B220+ bone marrow cells from 9-week-old mice. F. Absolute number of B220+ bone marrow cells that are IgM-IgD-, IgM+IgD- (immature B cells), and IgM+IgD+ (mature B cells). Numbers in plots and histograms indicate the percentage of each gated population. Charts show the mean value with error bars indicating the standard deviation (Lmna+/+ N = 3; Lmna-/- N = 3 for each indicated age group). P values were calculated using an unpaired two-tailed Student's t test (* p<0.05, ** p<0.001).

