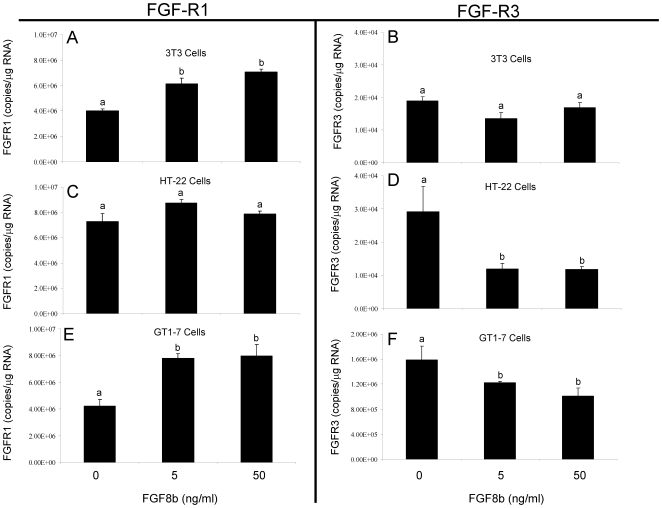
Figure 2. Comparative effects of FGF8b on Fgfr1 and Fgfr3 mRNA in 3T3, HT-22 and GT1-7 cells.
Fgfr1 and Fgfr3 mRNA levels in 3T3 cells (A, B), HT-22 cells (C, D), or GT1-7 cells (E,F) following treatment with vehicle or FGF8b at 5 or 50 ng/ml. for 4 hours. Data are expressed as mean copies of Fgfr1 or Fgfr3 transcript/µg total RNA ± SEM. Dissimilar letters indicate statistically significant difference among groups, P<0.05.

