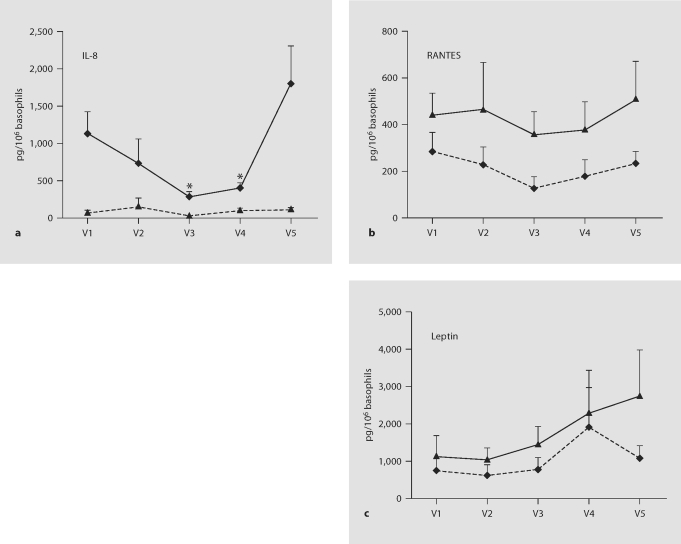
Fig. 3.
Effects of anti-IgE and omalizumab on IL-8, RANTES and leptin production. Supernatants from resting and activated (with 1 μg/ml anti-IgE) basophils from 9 volunteers were re-analyzed for a panel of cytokines by Luminex assays. a Luminex data for IL-8 replicate the ELISA evidence (fig. 2) for increased cytokine production in response to anti-IgE (p = 0.009 for differences between resting and anti-IgE-stimulated cells) and for reduced anti-IgE-stimulated cytokine production during omalizumab treatment (p = 0.01 for differences across the time course of omalizumab treatment and withdrawal). Asterisks localize the differences identified by paired t-tests (p < 0.05 in comparison with pre- and post-treatment cytokine production). b Luminex data for RANTES also showed increased cytokine production in response to anti-IgE (p = 0.01 for the comparison between resting and anti-IgE-stimulated cells). However, differences in anti-IgE-stimulated RANTES production across the time course of omalizumab treatment and withdrawal were not significant by ANOVA. c Leptin production was not affected significantly by either anti-IgE stimulation or omalizumab.

