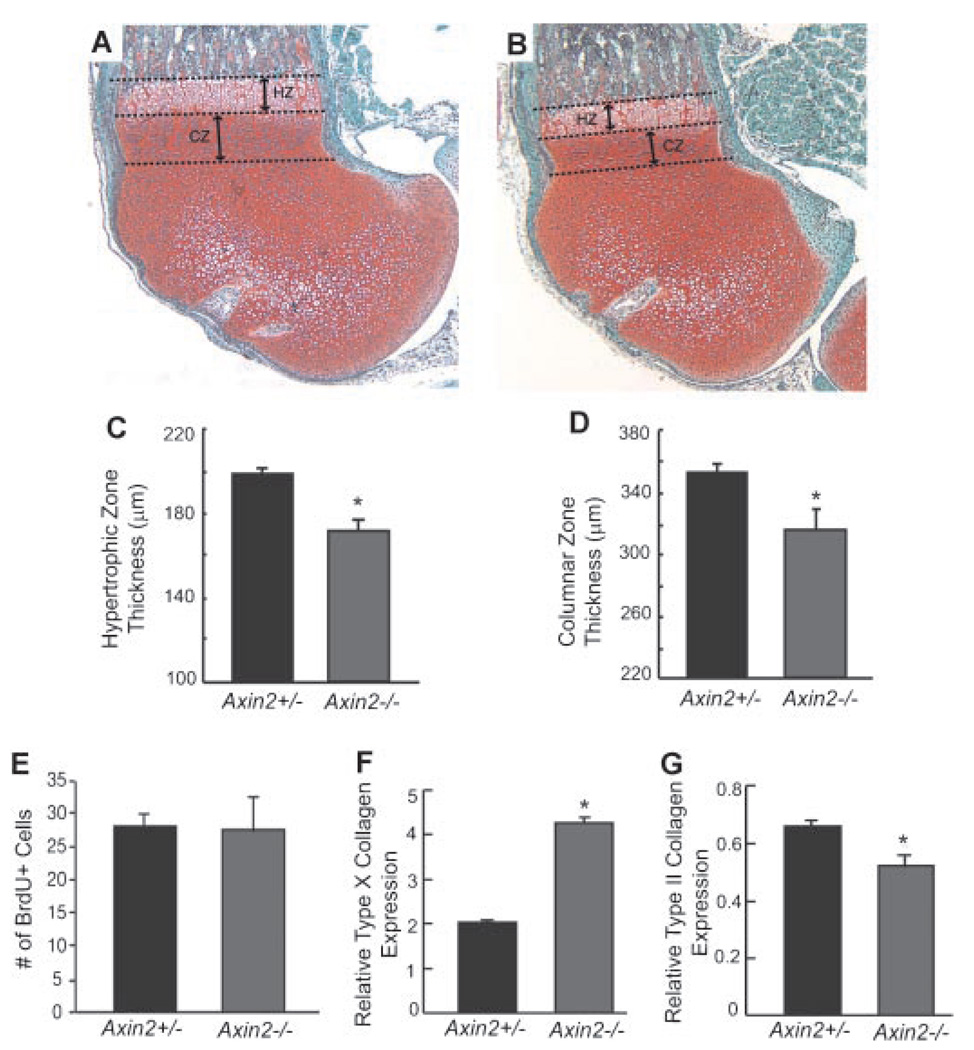
Figure 3.
Accelerated chondrocyte maturation in Axin2−/− mice. Representative photomicrographs (original magnification, ×40) of distal femurs in 1-week-old Axin2+/− [n = 13 (A)] and Axin2−/− [n = 7 (B)]. Histomorphometric measurements of hypertrophic zone (HZ) thickness (C) and columnar zone (CZ) thickness (D). (E) Quantification of BrdU-positive cells in the epiphyseal region. Real-time RT-PCR analysis of type X collagen (F) and type II collagen (G) gene expression in primary chondrocytes isolated from Axin2+/− and Axin2−/− mice. Results are shown as mean ± SD. *p<0.05 using unpaired t-test.

