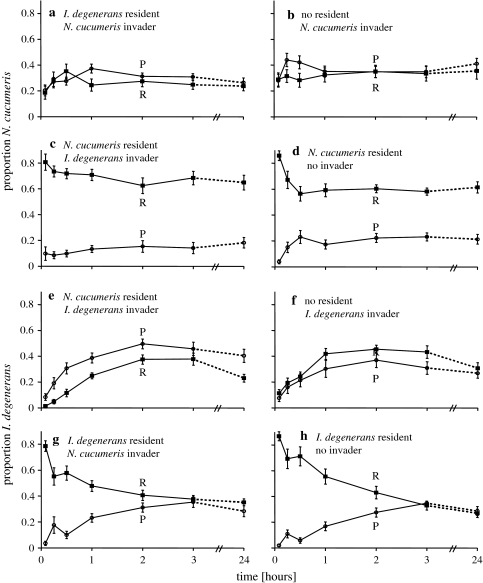
Fig. 3a–h.
Time series of the distribution of mites on the patches with food, P and R (Fig. 2). The resident was released 24 h before the start of the experiment on patch R, which had ample food. There was also ample food on patch P, on which no mites were released. Shown are the proportions of mites on the two food patches R and P. Note that these fractions do not necessarily sum to 1, because a proportion of the mites resided at the patches without food (see Fig. 2). a, c, e, g Time series in the treatments with two species; b, d, f, h corresponding controls with only one species. a–d Response of Neoseiulus cucumeris, e–h response of Iphiseius degenerans. For abbreviations, see Fig. 2

