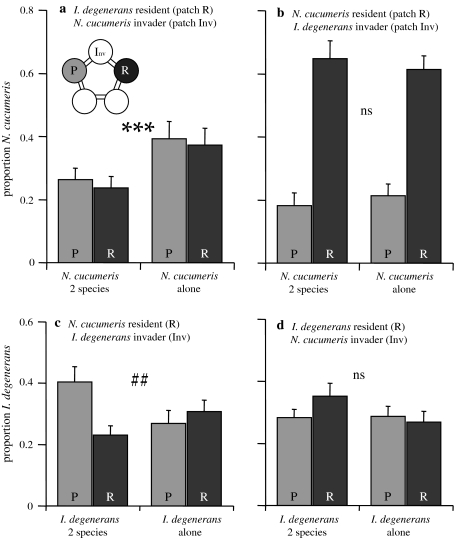
Fig. 4a–d.
Distribution of mites after 24 h on the patches with food, P and R (see Fig. 2). These are the same data as in Fig. 3 at t = 24 h. Shown are the proportions of mites on the two food patches, R and P. a, d I. degenerans was the resident (released on patch R), N. cucumeris the invader (released on patch Inv; Fig. 2). b, c N. cucumeris was the resident (patch R) and I. degenerans the invader (patch Inv). *** indicates that the distribution over the summed pollen patches (P + R) versus the summed empty patches (Inv + E) differed between treatments (P < 0.001). ## indicates that the distribution over the two pollen patches (P vs. R) differed between treatments (P < 0.01). For abbreviations, see Fig. 2

