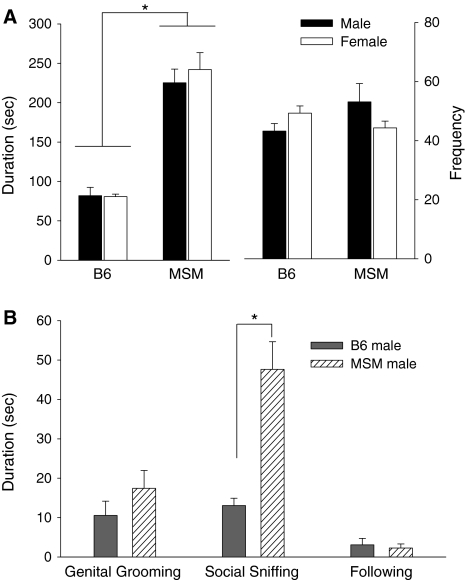
Fig. 1.
Social interaction behavior in B6 and MSM mice. a Duration (left side) and frequency (right side) of social contact. b Duration of detailed social interaction behavior (genital grooming, social sniffing, and following). Bars represent mean ± SEM. Asterisk indicates significant difference between B6 and MSM (P < 0.001)

