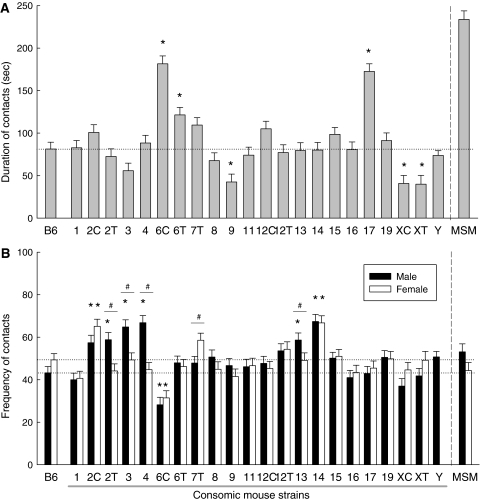
Fig. 2.
Social contact behavior in consomic mouse strains and B6. a Duration of social contact. Male and female data were combined because there was no strain-sex interaction. * P < 0.05 compared to B6. b Frequency of social contact in males and females. * Indicates significant differences with respect to the corresponding sex from B6 (P < 0.05). # Indicates significant sex differences within a strain (P < 0.05). The horizontal dotted line shows the mean for B6. MSM was excluded from the ANOVA analysis

