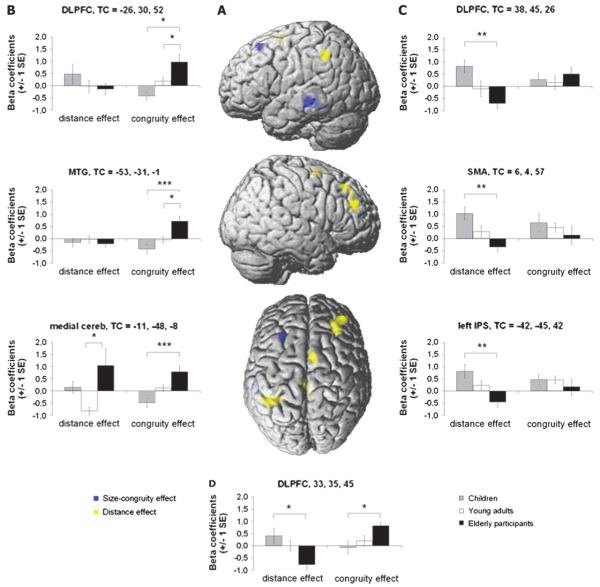
Figure 2.
(A) Brain areas showing a significant positive association between congruity effect and age are shown in blue, whereas regions showing a negative association between the distance effect and age are shown in yellow. Graphics in (B–D) depict the statistical comparisons between age groups in the ROI analyses. (B) Regions showing a significant effect of age on the fMRI activation triggered by interference control. (C) Regions showing a significant effect of age on the fMRI activation triggered by magnitude processing. (D) Dorsolateral prefrontal region showing a significant effect of age on the fMRI activation triggered by both interference control and magnitude processing.

