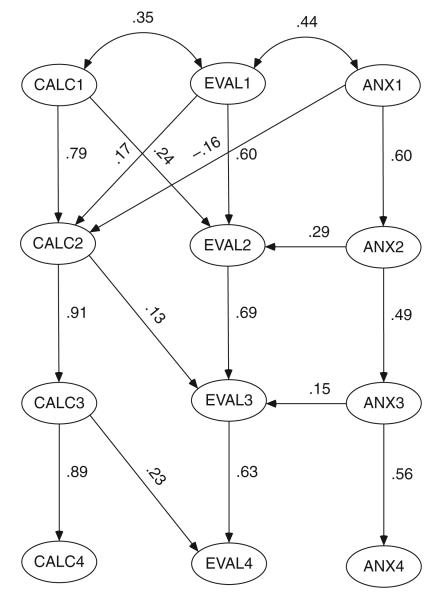
Figure 4.
Longitudinal Model (Standardized Solution, Structural Part Only) for Linking Calculation Performance (CALC; 4 Observed Variables Each), Evaluation of Mathematics (EVAL; 2 Observed Variables Each), and Math Anxiety (ANX; 2 Observed Variables Each) for Primary School Children From the End of Grade 1 (T1) to the Middle of Grade 3 (T4)
Note: All paths p < .10; fit statistics: X2/df = 1.29; Adjusted goodness of Fit Index = .771; Comparative Fit Index = .968; Root Mean Square Error Approximation = .046.

