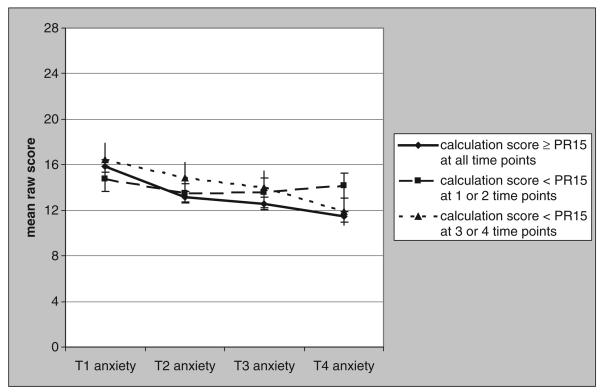
Figure 6.
Development of Mean Raw Math Anxiety Scores (Sum Score With 0 as Most Negative and 28 as Most Positive Possible Outcome) for Each Calculation Performance Group From T1 (End of Grade 1) to T4 (Middle of Grade 3)
Note: Black line is the calculation score ≥ 15th percentile at all time points; long dashed line is the calculation score < 15th percentile at one or two time points; short dashed line is the calculation score < 15th percentile at three or four time points. Error bars represent standard deviations of the mean.

