
Figure 2.
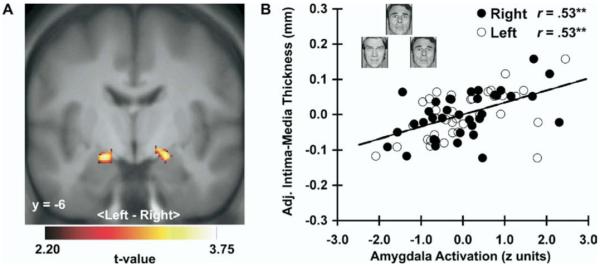
Carotid intima-media thickness (IMT) covaried positively with dorsal amygdala reactivity to angry and fearful facial expressions. (A) Parametric maps from an ROI regression analysis identifying clusters of the left [MNI coordinates: −16, −8, −14; t(30) = 3.72, z = 3.34, pFDR = .02, puncorrected < .001, k = 87] and right [20, −6, −14; t(30) = 3.56, z = 3.23, pFDR = .03, puncorrected = .001, k = 63] areas of the dorsal amygdala where carotid IMT covaried with amygdala reactivity after covariate control for age, sex, resting systolic blood pressure, and family income. Maps are masked by an anatomical amygdala ROI, are shown at an ROI-volume corrected threshold (pFDR < .05, k = 20), and are projected onto a coronal section of an averaged MNI-transformed template derived from study participants. (B) Covariate-adjusted IMT is shown as a function of mean-centered and standardized amygdala BOLD activation values (faces > shapes contrast parameters, see Methods and Materials) extracted from the peak voxels of the left (L, open circles, dashed line) and right (R, closed circles, solid line) amygdala clusters profiled in (A). Inset in (B) illustrates sample trial from the facial expression matching task designed to elicit amygdala reactivity. **p < .001. BOLD, blood oxygenation level-dependent; L, left; MNI, Montreal Neurological Institute; R, right; ROI, region of interest. Face stimuli copyrighted by Paul Ekman (Ekman and Friesen [1976], reprinted with permission).