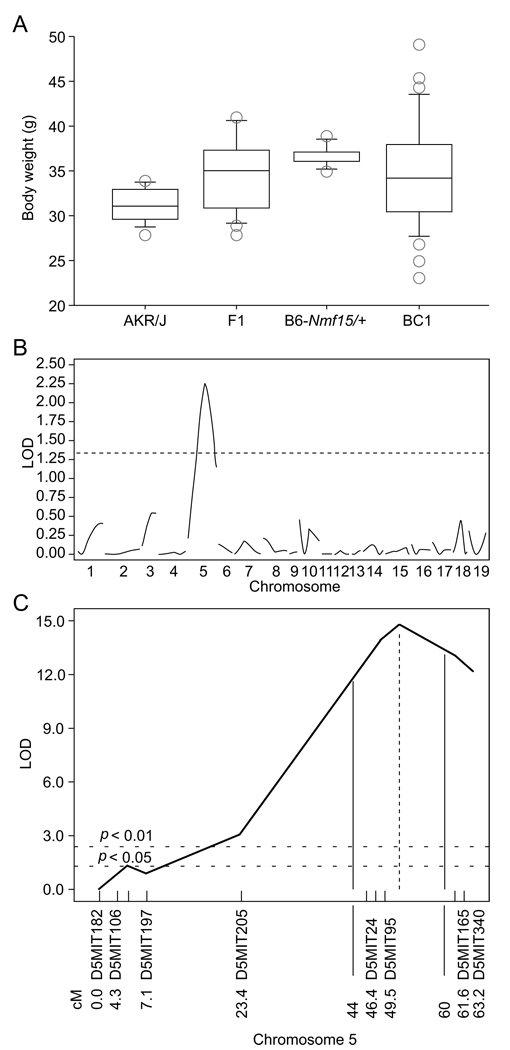
Figure 1. Mapping of the Nmf15 locus.
Distribution of 12 wk body weights from a (AKR/J × B6-Nmf15/+)F1 × AKR/J backcross (A). Genome scan and chromosomal mapping. A suggestive map location for Nmf15 was found on chromosome 5 (B). The location was confirmed in a second backcross (n=239) with a peak LOD score of 13.8 on distal chromosome 5. The 95% confidence interval was between 44 cM and 60 cM (C).
(Figure 1A was generated by StatView 4.5. 1) The Std.Dev (SD) is indicated by the bar above the box; The Ste.Err (SE) is represented by the bar under the box. 2) The circles above and below the box represent the values of BW from animals that are higher than group Ste.Dev (SD), and lower than group Ste.Err (SE), respectively. 3) The line inside of the box is the mean value. 4) The box is representing the range of total animals’ bodyweight distribution.)

