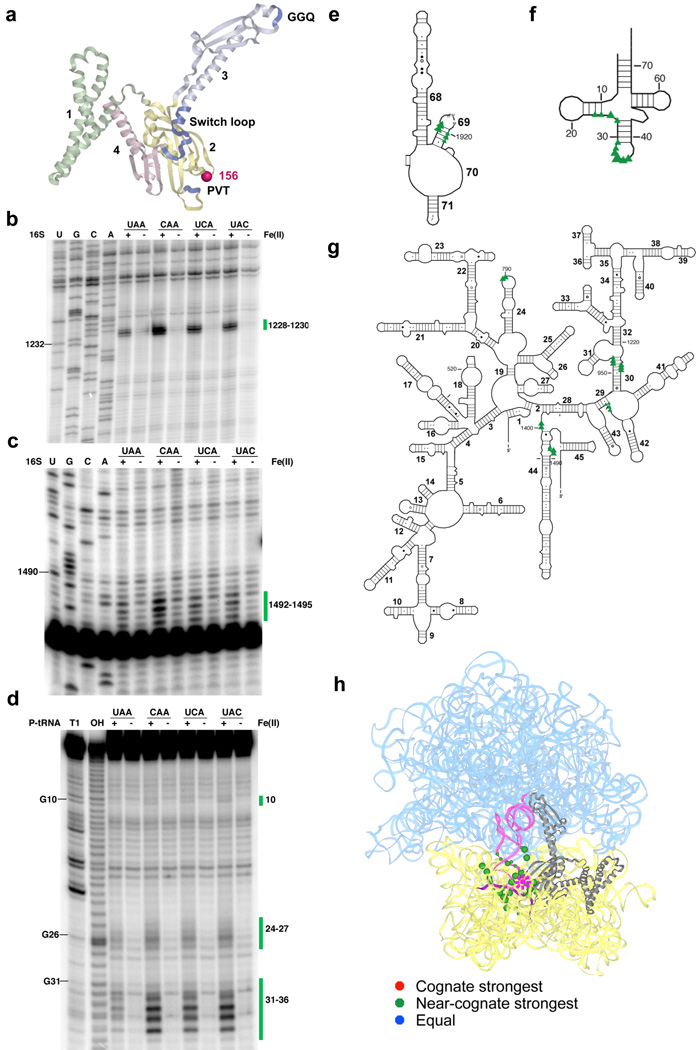
Figure 1.
Directed hydroxyl radical probing of the interaction between the codon recognition domain of RF1 and the ribosome in complexes programmed with various codons in the A site. (a) Ribbon diagram of RF1 (PDB entry: 3D5A10). Functionally important motifs including “PVT” tripeptide anticodon, catalytic “GGQ” and switch loop are shown in blue. Each domain is labeled by number and shown in different colors. Sphere indicates Cα of residue 156 where Fe(II) is tethered. Three-dimensional structures were prepared in Pymol (http://pymol.sourceforge.net). (b–c) Primer extension analysis of cleavage pattern of 16S rRNA from saturating levels of Fe(II)-H156C-RF1 in ribosome complexes with UAA, CAA, UCA or UAC codons in the A site. (U, G, C and A) are sequencing lanes. (+) represents the Fe(II)-H156C-RF1 sample while (−) represents the sample treated with mock labeled Cysless-RF1. Primers used begin extension at position 1391(b) and 1508 (c). (d) Denaturing sequencing gel analysis of cleavage of P-site tRNA from Fe(II)-H156C-RF1. (T1) cleavage by RNaseT1; (OH) alkaline hydrolysis ladder. Bars and numbers at right indicate cleavages corresponding to nucleotides within 16S rRNA or P-site tRNA. (e–g) Directed hydroxyl radical cleavage sites from Fe(II)-H156C-RF1 shown on the secondary structure25 of (e) part of the 3′ half of 23S rRNA, (f) P-site tRNA and (g) 16S rRNA. Triangle size reflects cleavage intensity relative to the strongest hits for that particular complex. (h) All cleavage sites modeled on tertiary structure of RF1 bound ribosome complex (PDB entry: 3D5A10 and 3D5B10). 16S rRNA from 30S subunit and 23S rRNA from 50S subunit are shown in yellow and cyan, respectively, while the ribosomal proteins are omitted. RF1 is shown in gray; P-site tRNA is in pink and mRNA is deep purple. Star represents the position to which Fe(II) is tethered, spheres indicate targeted sites (with size reflecting relative cleavage intensity). Overall cleavage patterns are indicated with various colors (stronger on cognate (red), stronger on near-cognate (orange), and equivalent on all (blue)). Unless otherwise indicated, same labeling scheme used throughout manuscript.

