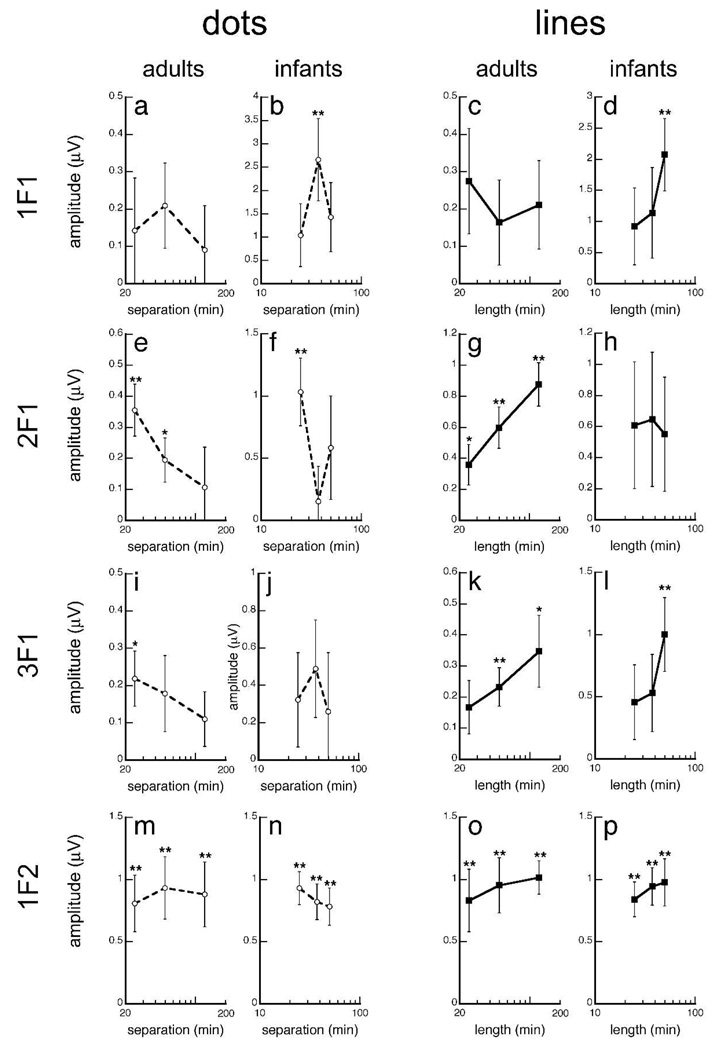
Figure 6.
Projected amplitudes as a function of [LEFT] dot pair separation and [RIGHT] line length. Infants and adults show a similar trend -- global responses decreased with dot pair separation and increased with line length. However, infants have shorter interpolation spans than adults such that global responses were only significant when dot pair separation is <49.6 min. Error bars represent ±SEM. *p-value<0.05, **p-value<0.001 two-tailed two-sample t-test.

