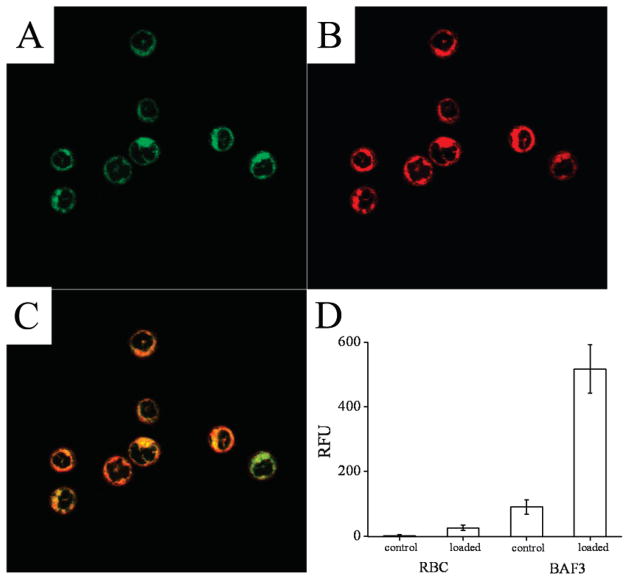
Figure 3.
Internalization of SphFl in live cells. (A–C) Confocal images of BA/F3 cells loaded with SphFl and the LavaCell. Panels A and B were obtained at excitation/emission wavelengths of 488 nm/518 nm and 543 nm/585 nm, respectively. Panel C is the overlay of the images in panels A and B. Regions of colocalized SphFl and LavaCell appear yellow. (D) Fluorescence intensities measured for loaded and unloaded (control) BA/F3 cells and sheep erythrocytes. The fluorescence intensities of a minimum of 33 individual cells were averaged for each histogram.

