
Figure 4.
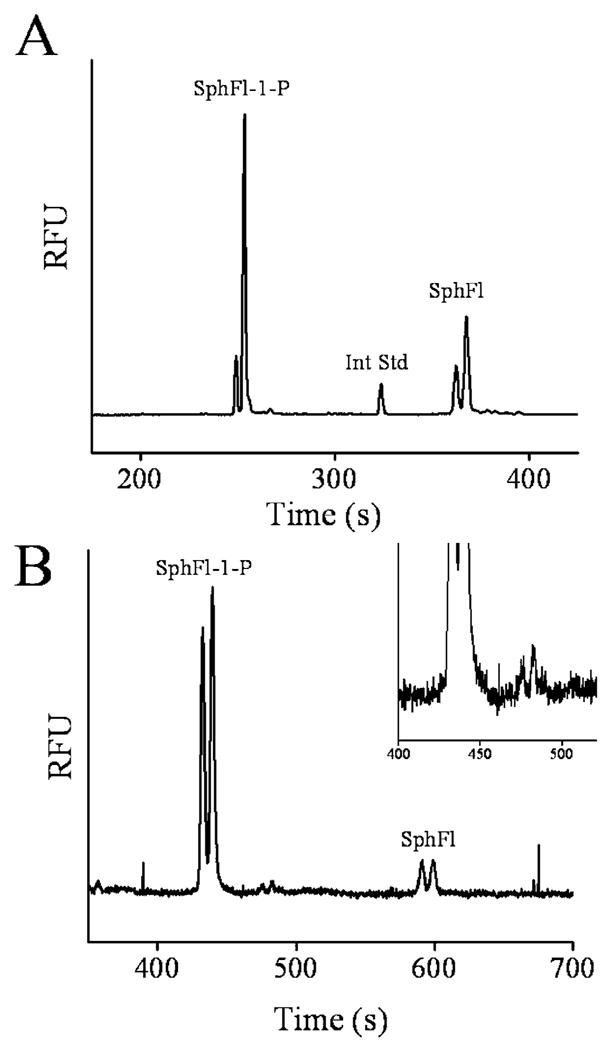
Shown are electropherograms obtained from sheep erythrocytes after incubation with SphFl. (A) Analysis of a bulk cell lysate generated after incubation of cells with SphFl (20 μM) and Bodipy-FlC16 (14 μM) followed by lysis. (B) Electropherogram obtained after intact erythrocytes were incubated with Sph-Fl (20 μM) for 15 min followed by aspiration of 10 cells into the capillary. The inset shows a blow up view of baseline in region of the SphFl-1-P peak. A small unidentified peak pair is seen.