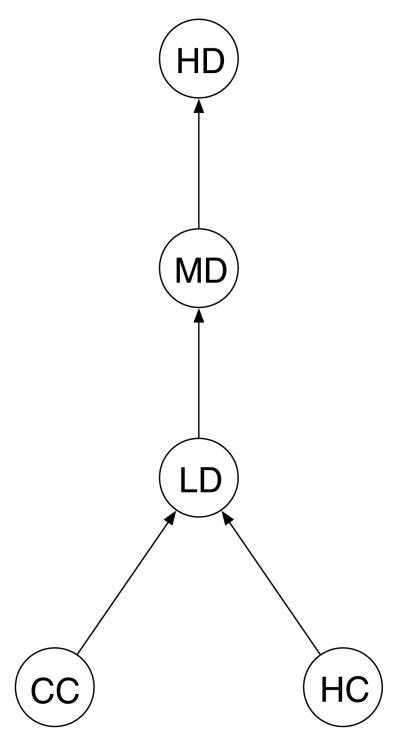
Figure 1.
Directed Graph Representing the Trends of Interest. The circles denote parameters in the historical control (HC) group, the current control (CC) group, the current low-dose (LD) group, the current mid-dose (MD) group, and the current high-dose (HD) group. The arrow between a pair of circles points toward the larger parameter.

