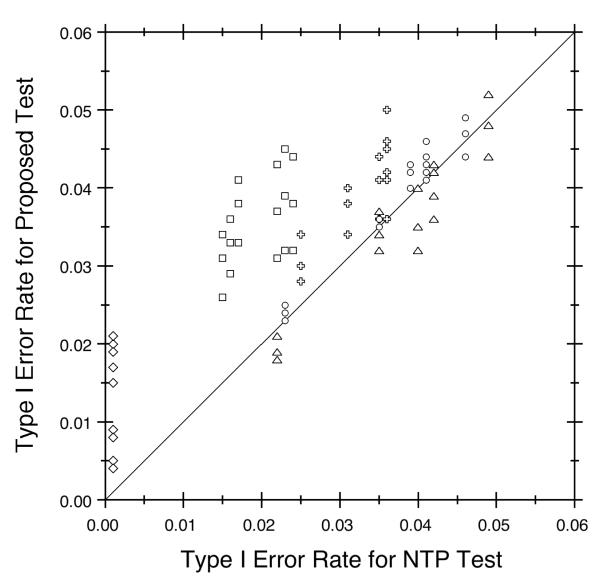
Figure 2.
Type I Error Rate Comparison for Proposed Test (W) Versus NTP Test (WNTP). Different symbols identify the various background tumor rates: 0.001 (diamonds), 0.01 (squares), 0.05 (pluses), 0.15 (circles), and 0.30 (triangles). The diagonal reference line shows where the two trend tests have equal Type I error rates. The nominal level is 0.05.

