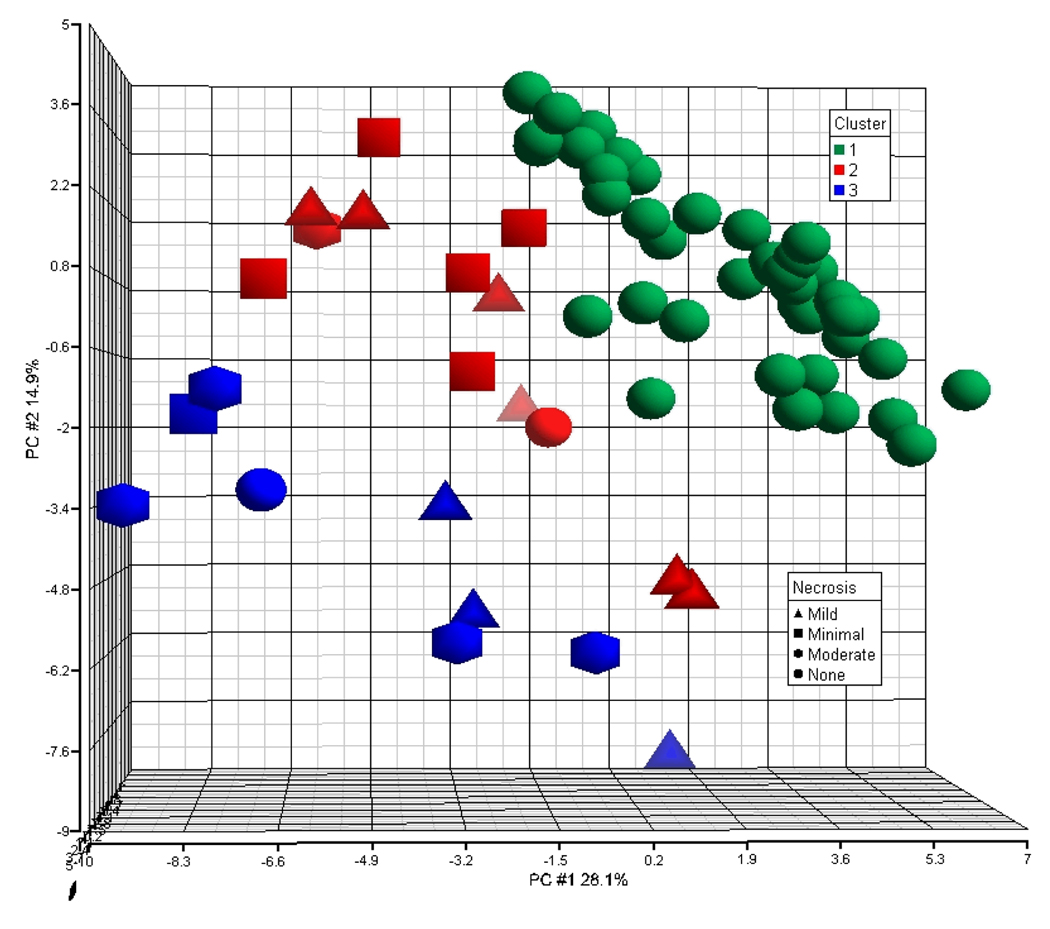
Fig. 3.
Principal component analysis of the gene expression data. The first 3 principal components (PCs) derived from the ~3100 differentially expressed genes were used to plot the samples into 3D space. The x axis is PC #1, the y axis PC #2 and the z axis PC #3. The samples are labeled by their respective cluster assignment (green-1, red-2, blue-3) and shaped by the severity of centrilobular necrosis observed.

