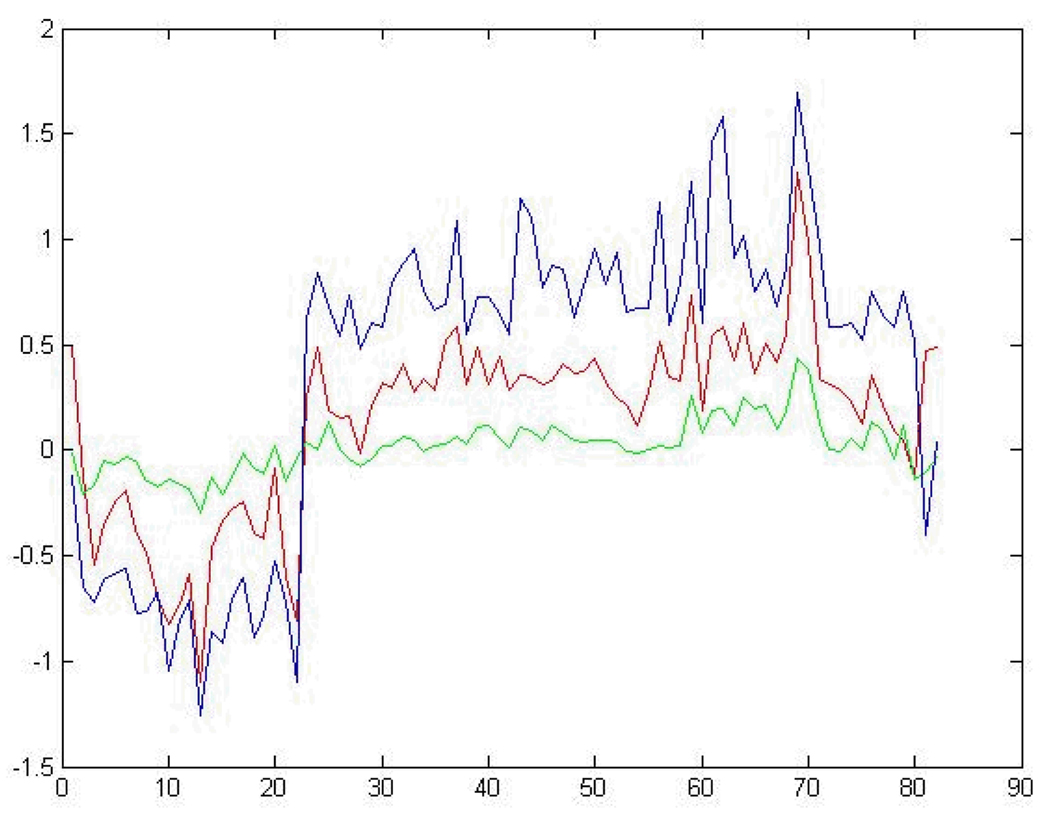
Fig. 5.
Gene expression components from selected genes in the phenotypic prototypes. Plotting of the gene expression component of the prototypes from the clusters generated from clustering the acetaminophen data using 86 genes selected as significant for distinguishing between levels of centrilobular necrosis. The lines and axes are as described in Fig. 4.

