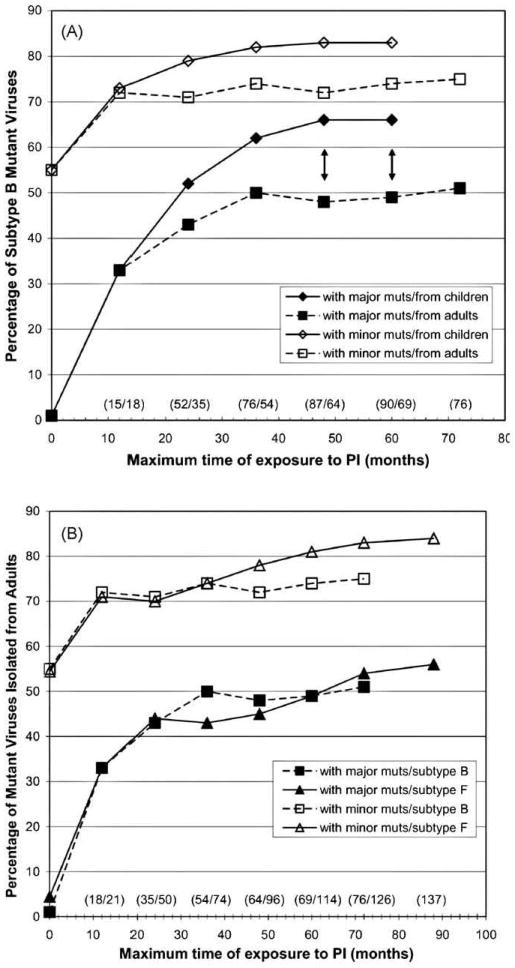
Fig. 1.

HIV-1 subtype B and F1 viruses with at least one major or minor resistance mutation. Different PI treatment exposure periods (in months) were plotted for each subtype and for each mutation class. (A) Comparison between subtype B isolated from infected adults and children; (B) comparison between subtypes B and F1 isolated from infected adults. Black double arrows denote significance in the difference of proportions between subtypes B isolated from children and adults at the 0.05 p-value level. The exposure time point 0 means the proportion of mutant strains isolated from untreated individuals. Numbers in parentheses above exposure time periods denote the number of sequences from children and adults (in panel A) and from subtypes B and F1 (in panel B), respectively.
