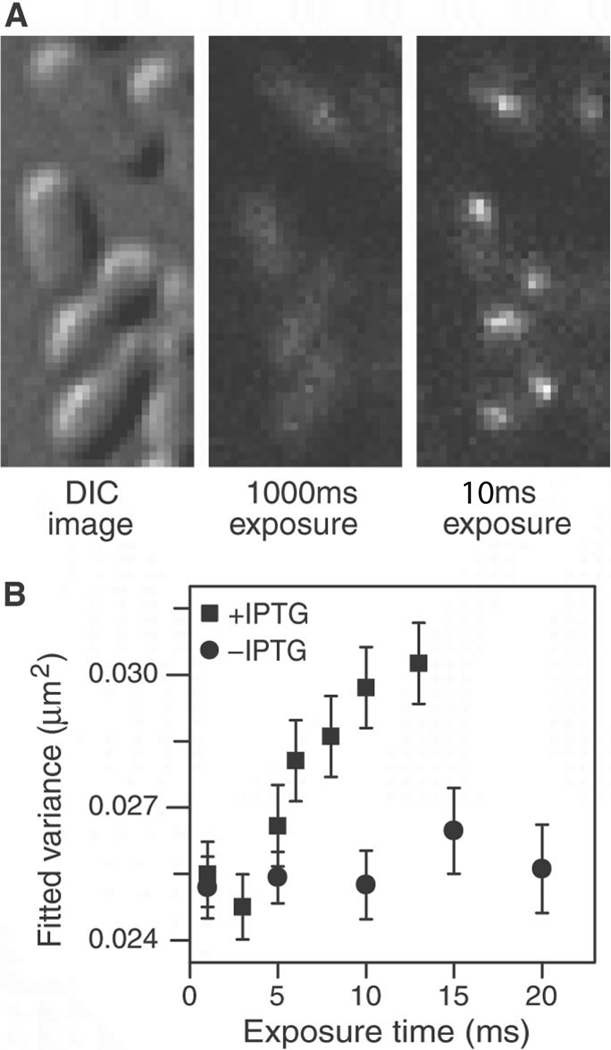
Fig. 3. Imaging nonspecifically bound LacI.
(A) Two fluorescence images with different exposure times and the corresponding DIC images of IPTG-induced E. coli cells. At 1000 ms, individual LacI-Venus appear as diffuse fluorescence background. At 10 ms they are clearly visible as nearly diffraction-limited spots. (B) Fluorescence spot size as a function of exposure time. The size is represented as the average variance of a 2D Gaussian function fit to images of fluorescence spots (±SEM, n~100). The same total excitation energy is used for different exposure time. The spots are measured before (−IPTG, •) and after (+IPTG, ▪) induction. The size converges to the width of the point spread function (full width at half maximum = 370 nm) below 5 ms.

