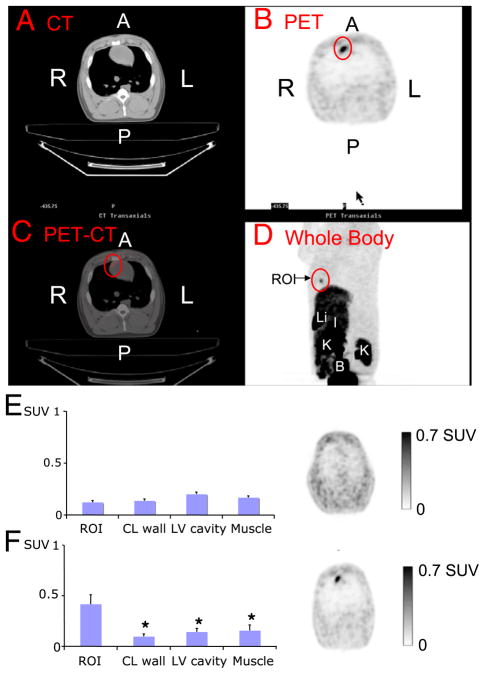
Figure 2. Representative Positron Emission Tomography (PET) Computed Tomography (CT).
(Top) Image of gene therapy 48 h after percutaneous gene delivery (A to D). (Bottom) Uptake of 18F-labeled 9-[4-fluoro-3-(hydroxymethyl)butyl]guanine (standardized uptake value [SUV]) in (E) control (n = 2) and (F) gene therapy (n = 4) groups. *p < 0.05 compared to region of interest (ROI) (red circle). A = anterior; B = bladder; CL = contralateral; I = intestines; K = kidney; L = left; Li = liver; LV = left ventricular; P = posterior; R = right.

