
Figure 3. Automated lineage analysis reveals epigenetic states.
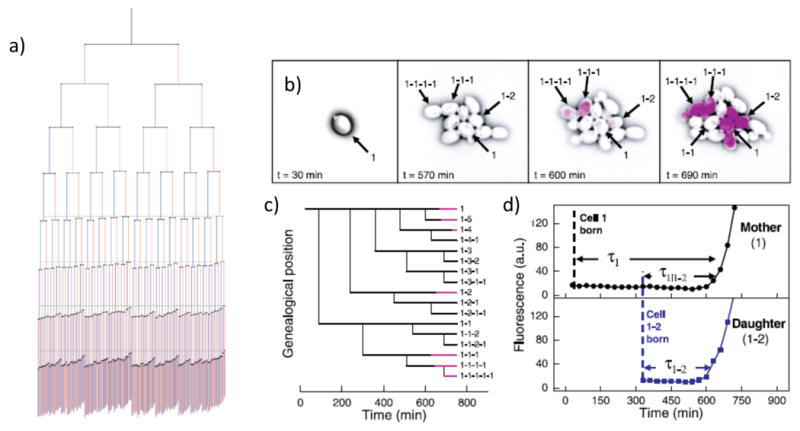
A) The aging of Escherichia coli (from 22). This lineage tree depicts 9 generations of E. coli from 94 movies. The lengths of the lines connecting cells to their progeny are proportional to the average growth rate of that cell, so a shorter line represents a shorter growth rate. At each division, the cell inheriting the old pole is placed on the right side of the division pair, and shown in red, while new poles are placed on the left side of each pair, and shown in blue. Green lines indicate the point at which the first cell divides in the last four generations. B-D) Genealogical switching history in the Yeast Galactose system (from 29). The first cell in each movie is designated cell number 1 and sequential daughters of that cell 1–1, 1–2, 1–3. These daughter cells bud in turn, giving rise to cells 1-1-1, 1-1-2, 1-2-1, etc. (B) An initially OFF cell grows into a variegated microcolony. Beginning at 600 min, or 4 generations, several cells fluoresce almost simultaneously. This includes the mother-daughter pairs (1,1–2) and (1-1-1,1-1-1–1). Conspicuously, cell 1–1 does not switch for the duration of the movie, even though its mother, daughter, and closest sibling all do. (C) The family tree for colony in (B). Black lines indicate cells in the OFF state, whereas pink lines represent cells after they have switched to the ON state.(D) Fluorescent time courses for mother cell 1 and her daughter 1–2, showing each as they switch into the ON state.