
Figure 5. Circuit level Dynamics.
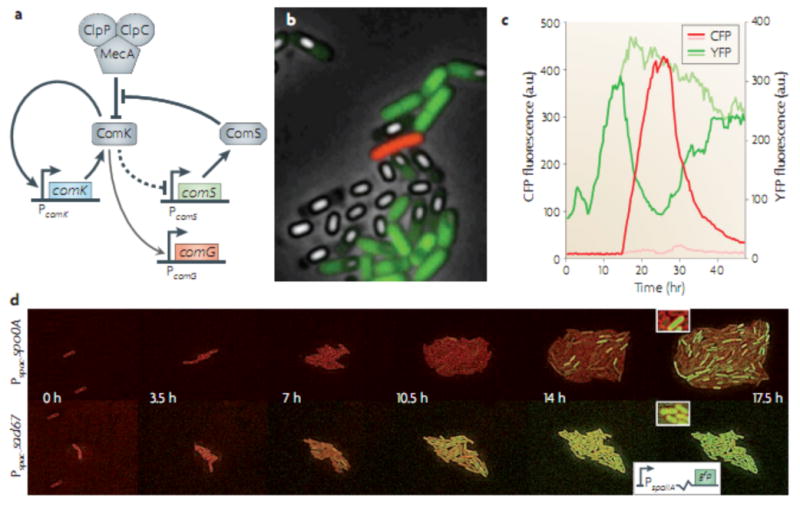
A-C) Analysis of Bacillus subtilis competence circuit dynamics in individual cells (from51). Part A) shows a snapshot from a movie. PcomS expression is shown in green and PcomG expression is shown in red. The red cell is in the competent state (high ComK levels). White depicts spores or sporulating cells. Part b shows a quantitative time series of PcomS –yellow fluorescent protein (yfp) (green lines) and PcomG –cyan fluorescent protein (cfp) red lines) for the competence event shown in A). Note the anti-correlation in expression between the two promoters, which can be explained by the circuit diagram in part C. PcomS and PcomG activities obtained from the non-competent sister cell are shown in light green and light red, respectively. Part C) shows a map of the effective regulatory interactions in the core competence circuit in B. subtilis. The dashed inhibitory arrow depicts indirect repression. ComS competes with ComK for degradation by the MecA–ClpP–ClpC complex, effectively stabilizing ComK. D) The B. subtilis phosphorelay is required to generate variability in sporulation in B. subtilis (From 53). Time-lapse microscopy shows that heterogeneity in this system does not require the positive-feedback loop of Spo0A on itself (top row), but does require the activity of the phosphorelay (bottom row). Membranes are stained with FM5–95 (red), and expression of the sporulation reporter PspoIIA is shown in green. The insets show a close-up of the cells.