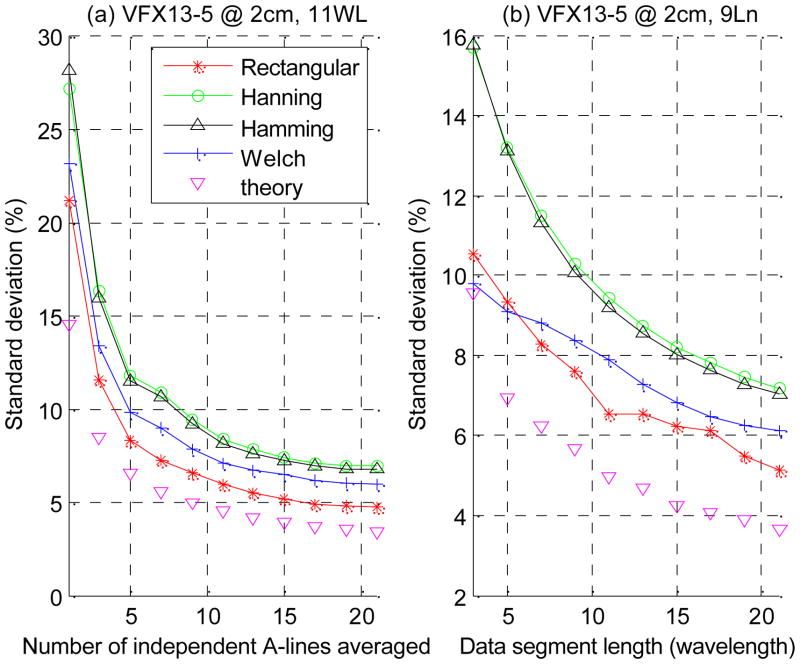
Fig. 5.
(a) Percent standard deviation of scatterer size estimates vs. the number of independent A-lines averaged when an 11-wavelength window is used; (b) percent standard deviation vs. window length when 9 independent A-lines are averaged. Results are for data acquired at 2cm depth using the VFX13-5 transducer. The theoretical values are calculated according to equation (5) assuming a rectangular window and equation (6).

