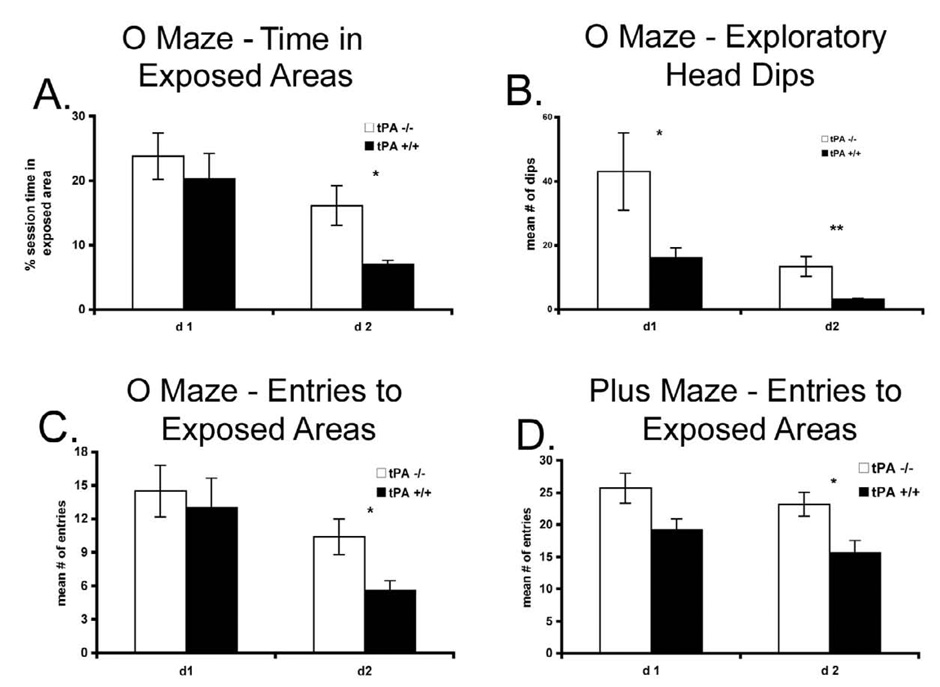
Figure 2.
A, the latency of the first entries in the open areas of an elevated “zero” maze were measured for the tPA−/− (n = 7) and wt (n = 8) mice, B, the number of entries to the exposed areas during the second day of testing was also quantified, and C, the number of head dips below the maze level on both days of testing. D, In the plus maze, the entry of tPA−/− mice (n = 12) into the open arms on the second day of testing were measured and compared to control mice (n = 14).

