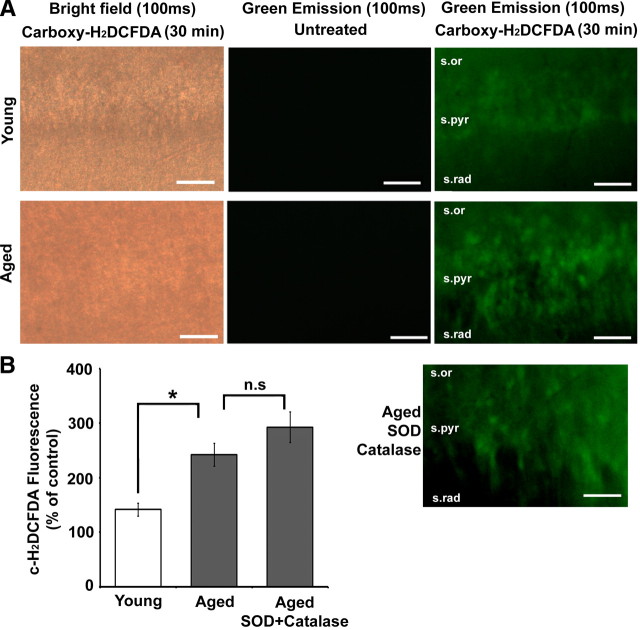
Figure 1.
Enhanced ROS production is observed in hippocampal tissue from aged rats. A, Indicated above each image column are the imaging conditions (bright field or green emission) and the exposure time (100 ms) for hippocampal slices that were either untreated or treated (Carboxy-H2DCFDA) with the dye. The rows are images of the CA1 region of young (top row) and aged (second row) hippocampal slices. The lowermost image is a Carboxy-H2DCFDA-treated slice from an aged animal, which was incubated with SOD + catalase. The various layers of hippocampal area CA1—stratum radiatum (s.rad), stratum pyramidale (s.pyr), and stratum oriens (s.or)—are indicated in the last set of images. Scale bars, 50 μm. B, Quantification of the mean fluorescence intensity generated by the oxidation of c-H2DCFDA (c-H2DCFDA Fluorescence) from young (n = 3) (open bar), aged (n = 3), and SOD + catalase-exposed aged (n = 3) (gray bars) hippocampal slices expressed as percentage of fluorescence in untreated (control) slices from the same animal. In this and subsequent figures, error bars represent SEM, asterisks indicate significant difference between the groups indicated, and n.s indicates no significant difference.

