Figure 7.
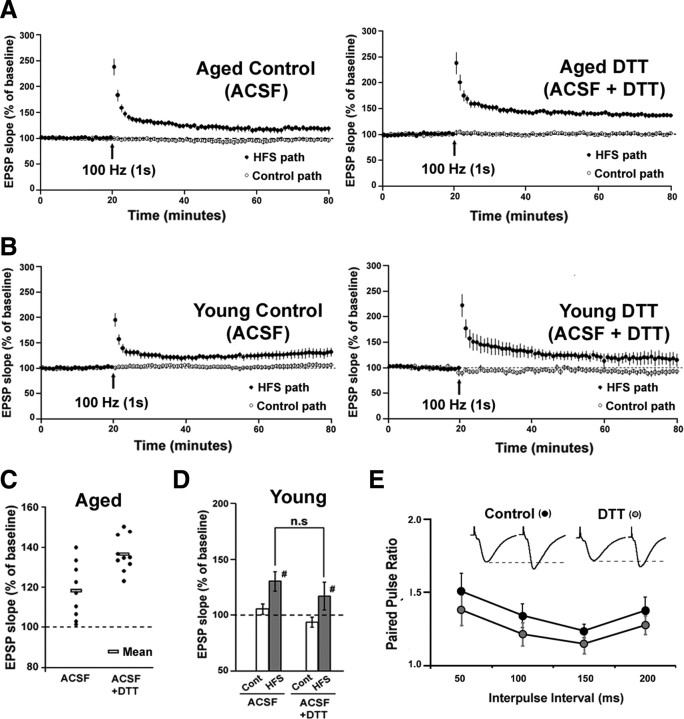
DTT enhances LTP in hippocampal area CA1 of aged animals. A, Time course for the expression of LTP recorded in hippocampal slices from aged animals. Slices were bathed in control ACSF (n = 9) or ACSF containing DTT (n = 10) for at least 45 min before HFS. Baseline stimulation was applied to a control pathway (open circles) and to a second pathway that received HFS (100 Hz, 1 s) (filled circles). Arrows denote HFS delivery. For purpose of clarity, each point represents the mean of two consecutive responses. B, Time course for the expression of LTP recorded in hippocampal slices from young animals. Slices were bathed in control ACSF (n = 6) (left) or ACSF containing DTT (n = 5) (right) for at least 45 min before HFS. Baseline stimulation was applied to a control pathway (open circles) and to a second pathway that received HFS (100 Hz, 1 s) (filled circles). Arrows denote HFS delivery. C, Distribution of the LTP magnitude for individual slices from aged animals bathed in control ACSF and ACSF + DTT. The rectangular boxes indicate the mean of each group. D, Quantification of the mean percentage change in the fEPSP slope recorded from the control (Cont) and HFS (HFS) pathways from young slices bathed in ACSF or ACSF + DTT. E, Plot of the paired-pulse ratio obtained under control conditions (black circles) and after 45 min bath application of DTT (gray circles) for four interpulse intervals (50, 100, 150, 200 ms). Inset: Responses obtained upon paired pulse stimulation (average of 5 consecutive traces; 50 ms interpulse interval) under control conditions and under DTT application.

