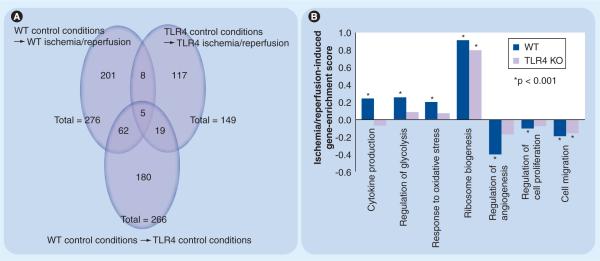
Figure 2. Microarray analyses on wild type and TLR4−/− primary mouse microglia following exposure to experimental or control conditions.
WT and TLR4−/− primary mouse microglia (pMG) were exposed to hypoxic/hypoglycemic (`ischemic') or normoxic/normoglycemic (`control') conditions for 24 h in triplicate. All cells were then exposed to 24 h of normoxic/normoglycemic (`reperfusion') conditions. RNA was extracted, analyzed and processed for cDNA synthesis and cDNAs were hybridized to a Mouse Gene 1.0 ST Array and raw data processed, normalized and analyzed as described [43,44]. Individual genes with evidence for significant differential expression between strains (WT vs TLR4−/−) and/or conditions (ischemia–reperfusion vs control) were identified as described [45]. Comparisons showing distinct and overlapping subsets of regulated individual genes are presented as Venn diagrams (A). Individual genes were sorted into biological processes (BP) using gene-set enrichment analyses (GSEA), as described [46,47]. Differential ischemia-induced regulation of selected BP categories between strains is presented here as a bar graph (B). All microarray data have been deposited in the Gene Expression Omnibus Database under accession number GSE18602.
KO: Knockout; TLR: Toll-like receptor; WT: Wild-type.

