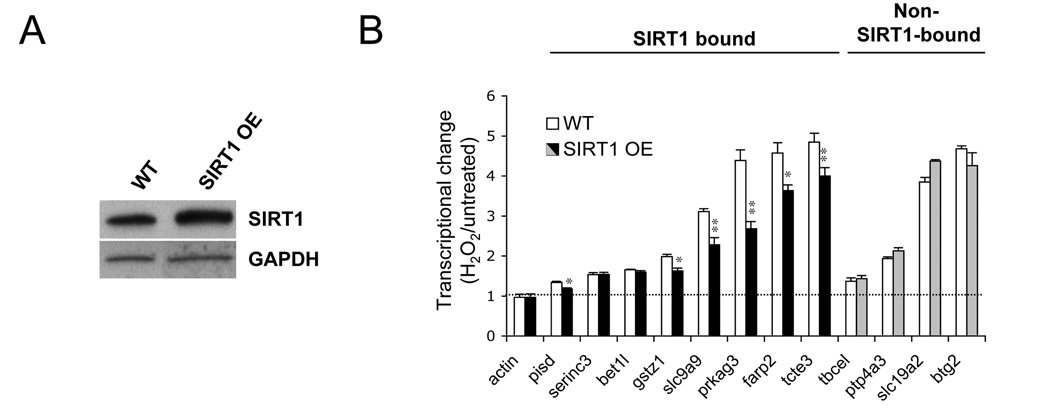
Figure 3.
Transcriptional deregulation of SIRT1-associated genes in response to oxidative stress is repressed by increasing SIRT1 levels. (A) SIRT1 expression in wild-type (WT) and SIRT1 overexpressing (OE) ES cells. (B) q-RT-PCR analysis of putative SIRT1 target genes (SIRT1-bound), non-SIRT1-bound control genes and β-actin in wild-type (open bars) and SIRT1 overexpressing ES cells (closed bars). Shown is the fold change of expression compared to untreated samples. Data are represented as mean +/− SEM.

