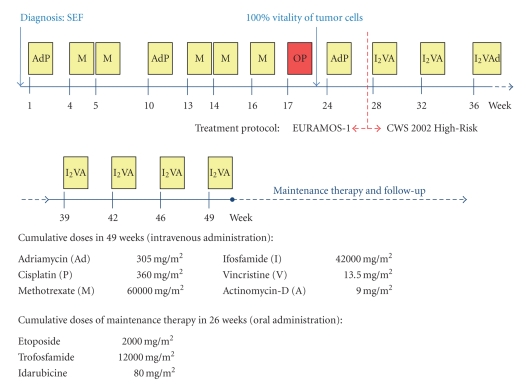
Figure 3.
Schematic illustration of the treatment regimen including cumulative dosages of the chemotherapeutic drugs. Each chemotherapy cycle of the main therapy is depicted as a yellow box, and the week when the cycle started is shown below. The time point of surgery and implantation of endoprosthesis is indicated with a red box (OP). The regimens of the maintenance therapy and follow-up are not displayed in detail.

